Flow Statement
Mapping Gender in Boston Bikeshare Rides
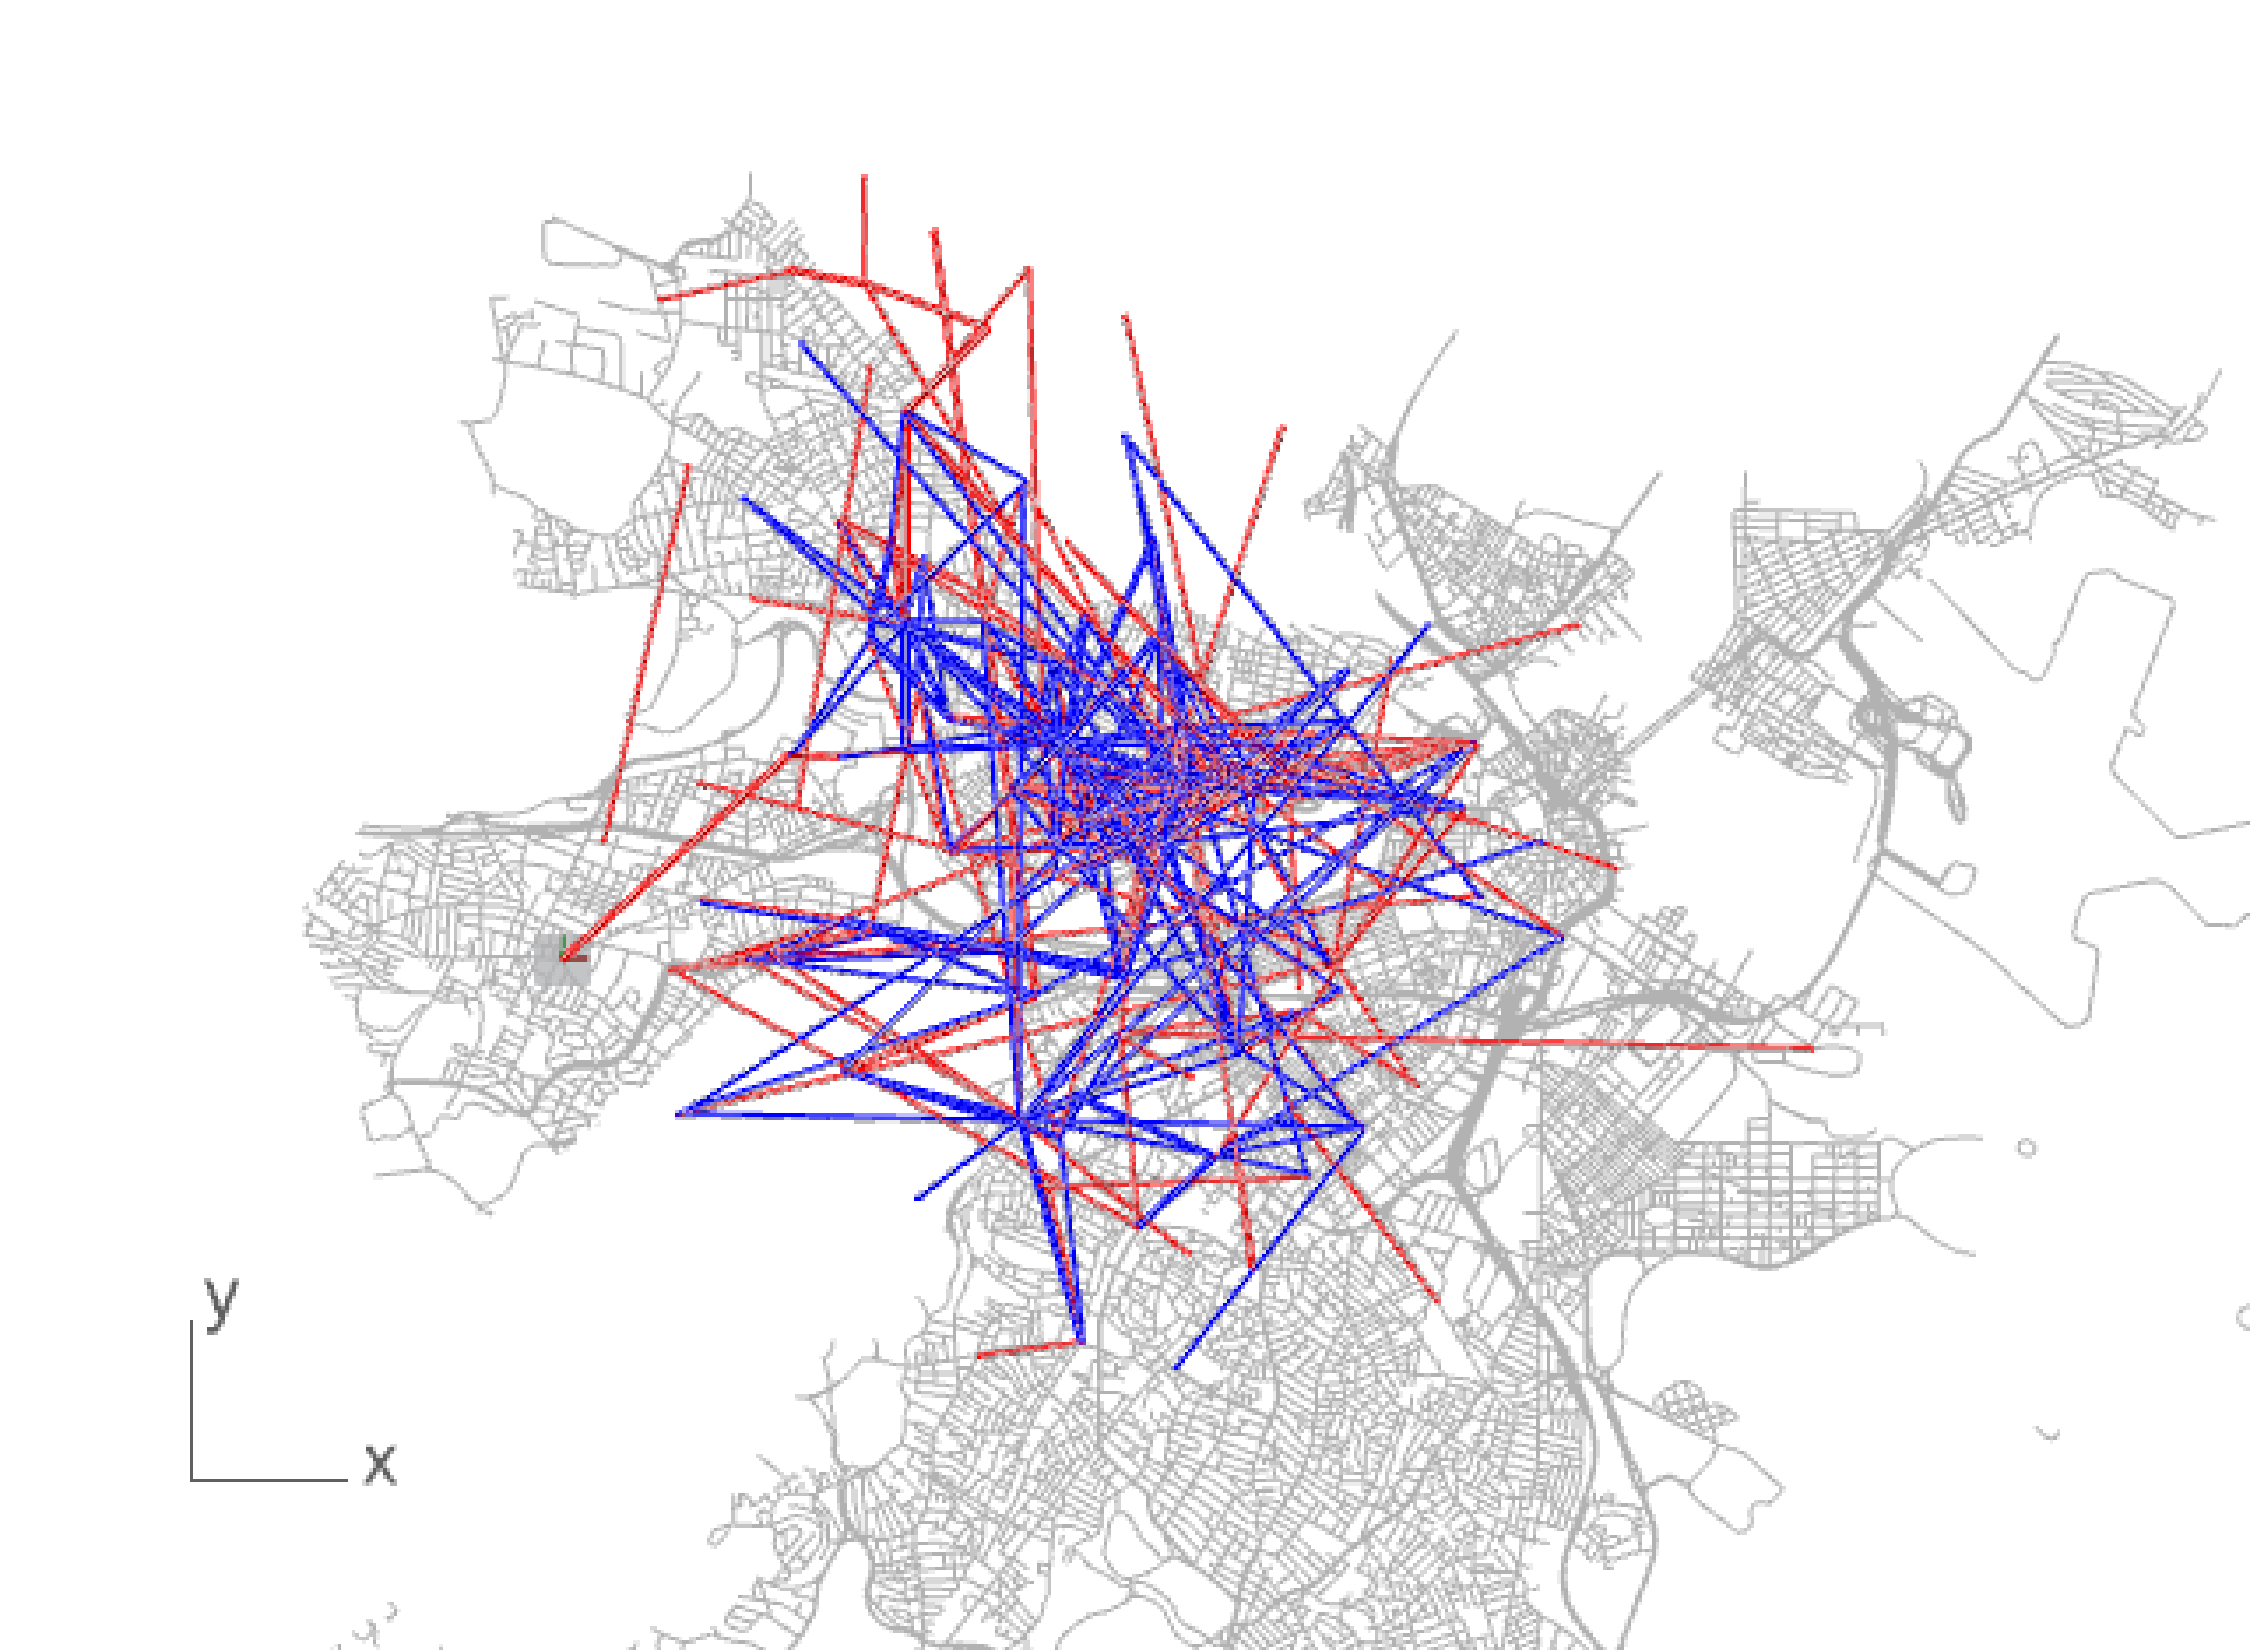
This project visualizes differences in Boston BlueBike users based on gender. The inspiration for this project comes from previous research demonstrating that city bike infrastructure caters to men’s preferences and commuting patterns. Whereas male riders often take direct routes on main thoroughfares at any time of the day, female riders are more likely to take roundabout paths within confined time windows. We wondered whether or not these patterns might be discernable in Boston’s BlueBike usage. To pursue this question, we obtained BlueBike trips for January 2019. We used ArcGIS Pro and R to clean the raw data into a dataset reflecting all trips taken 10 or more times across gender. We then used a Grasshopper plugin to read the shapefile into the Rhino environment. Since Grasshopper interprets the shapefile data as a data tree, we converted the tree into one long list of points that we then used to visualize the lines of each trip in two ways. First, we linked the magnitude of each line’s width to the number of trips taken for each mapped route; Second, we sought to animate the trips in chronological order based on the timestamp of the first trip taken for each route.