Visualizing Networks
Explorations in 3D Animated Representation
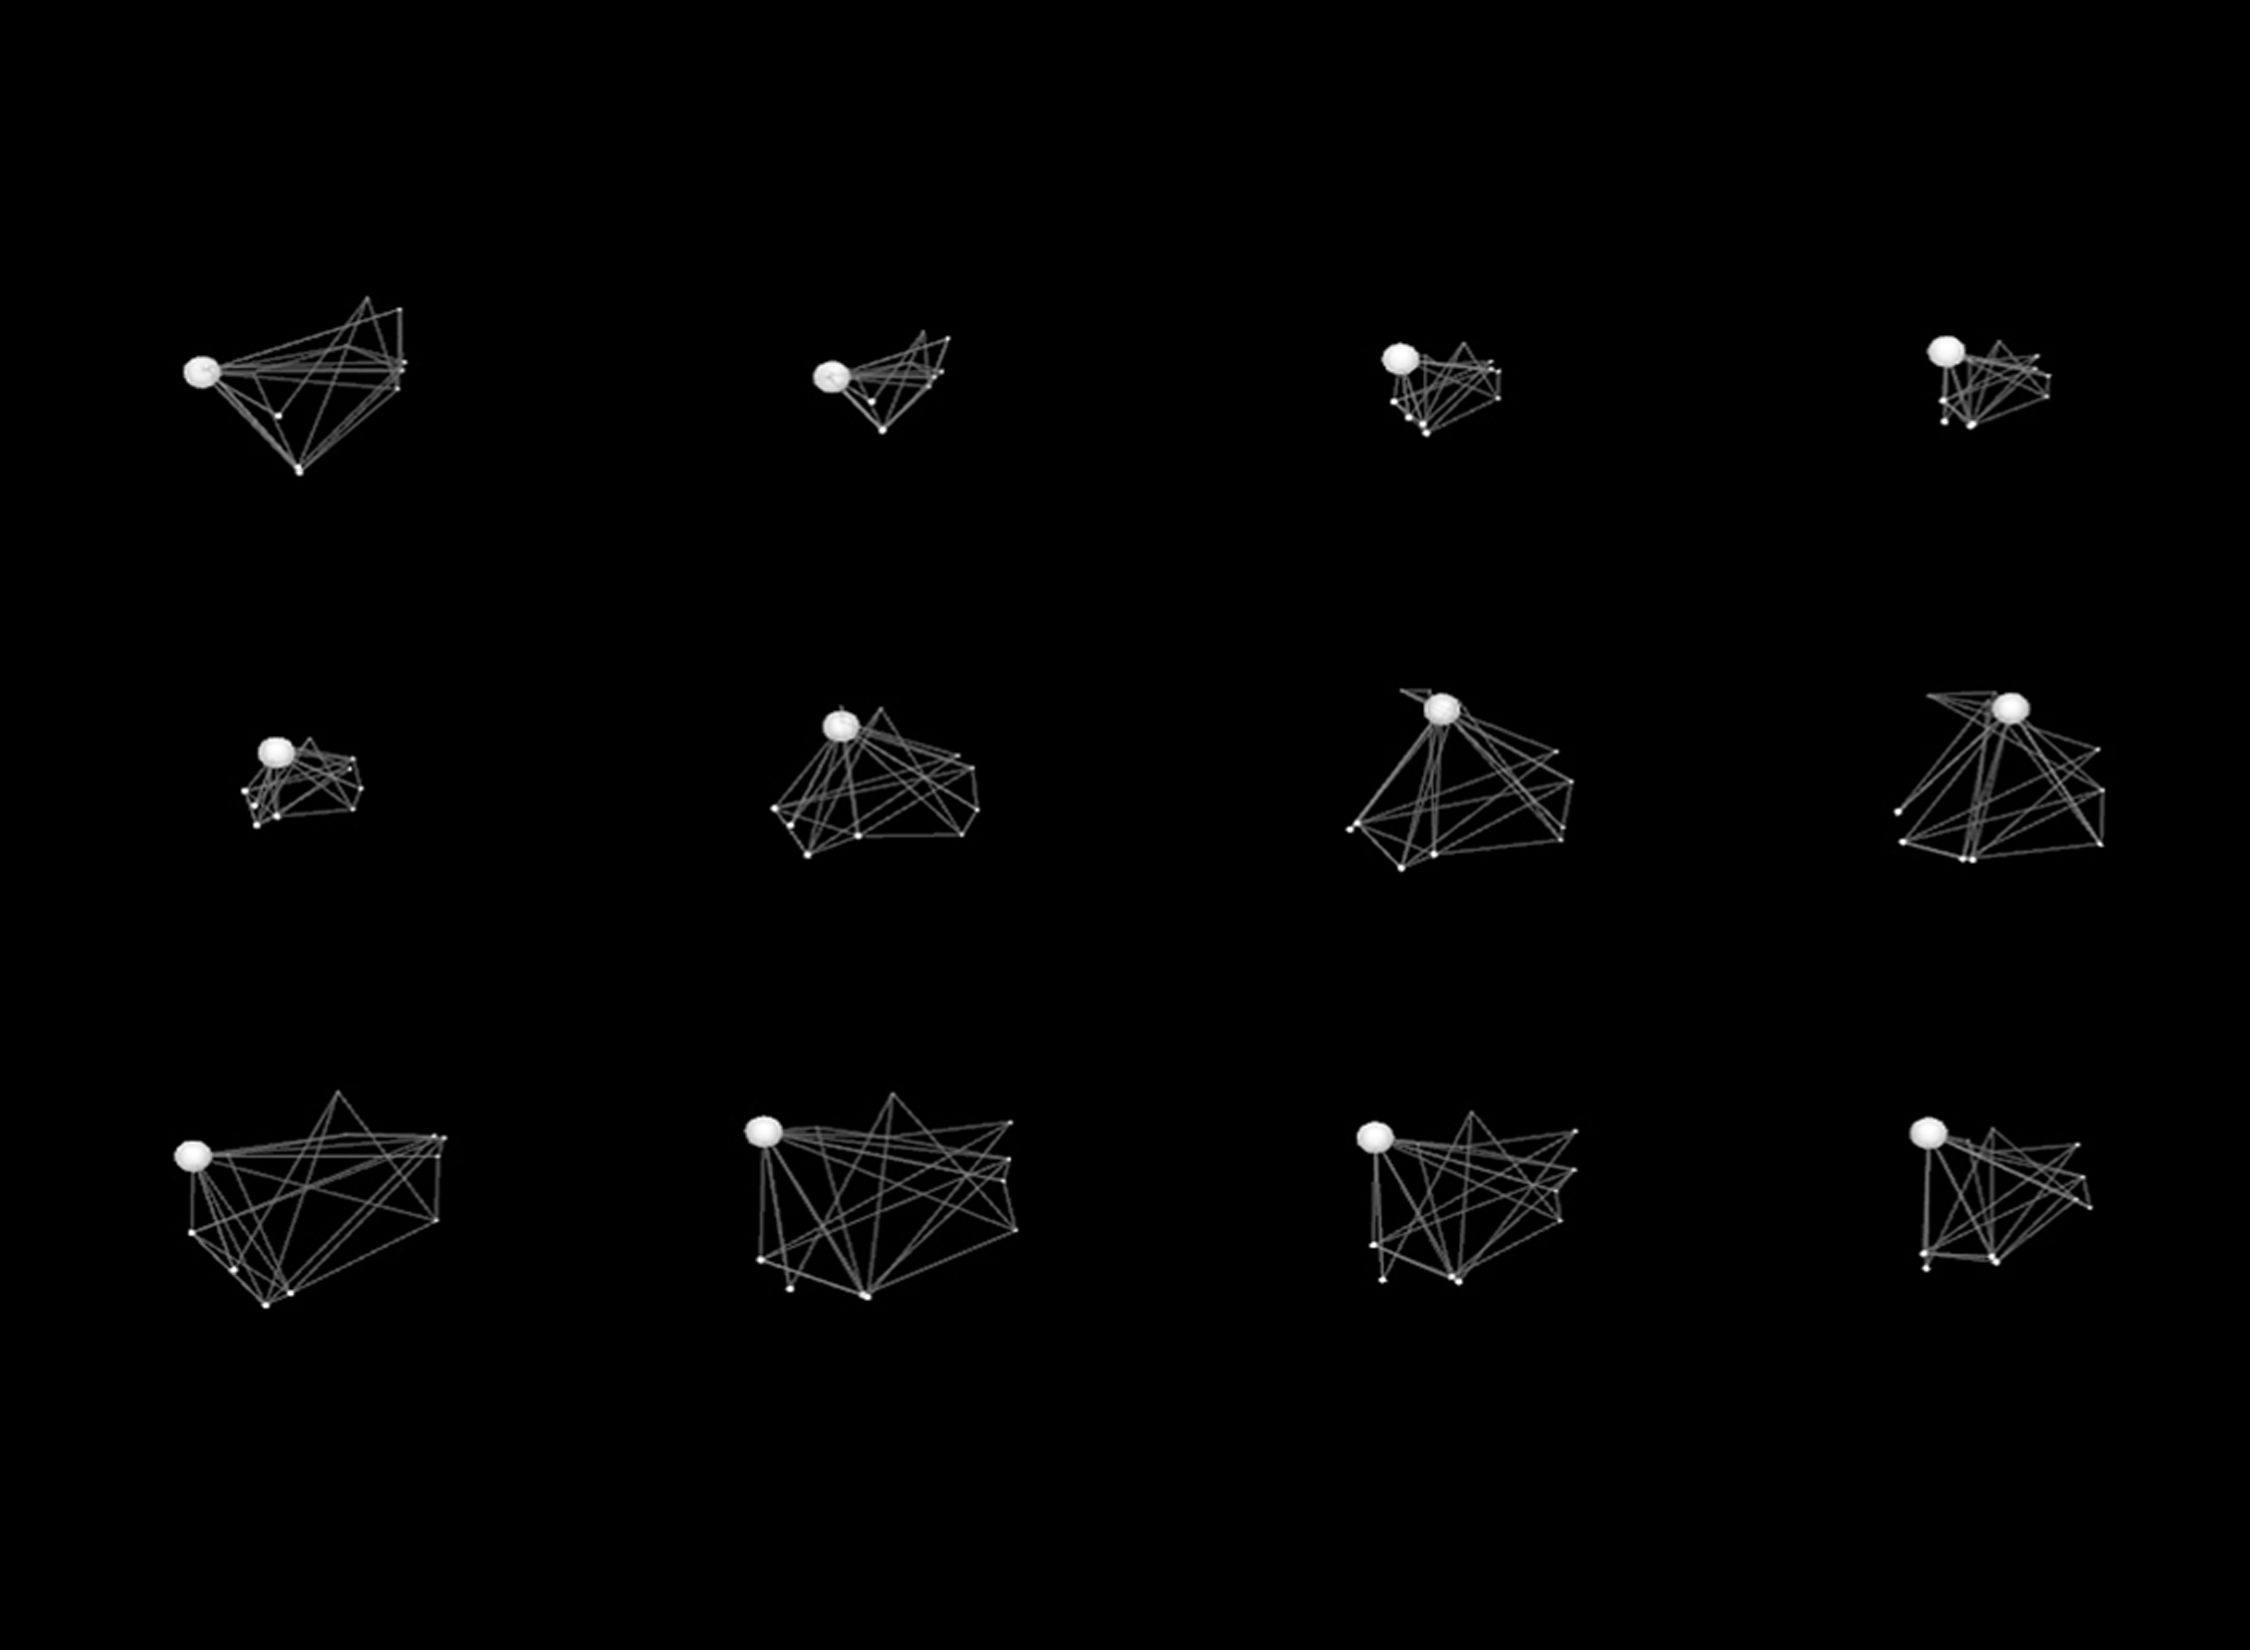
Graph theory is a branch of mathematics that analyzes relations between many objects, as a series of vertices and edges. The power behind graph theory is the ability to reduce a complex real situation into an abstract mathematical problem of vertices and edges. Visualizations of these graphs are usually 2-dimensional. Some chosen underlying logic arranges the position of the nodes. These are often seen as stylistic effects, since the global metrics of the graph do not change. But each visualization and arrangement of the nodes produces a different story about how the nodes are connected to one another and what trends are present.
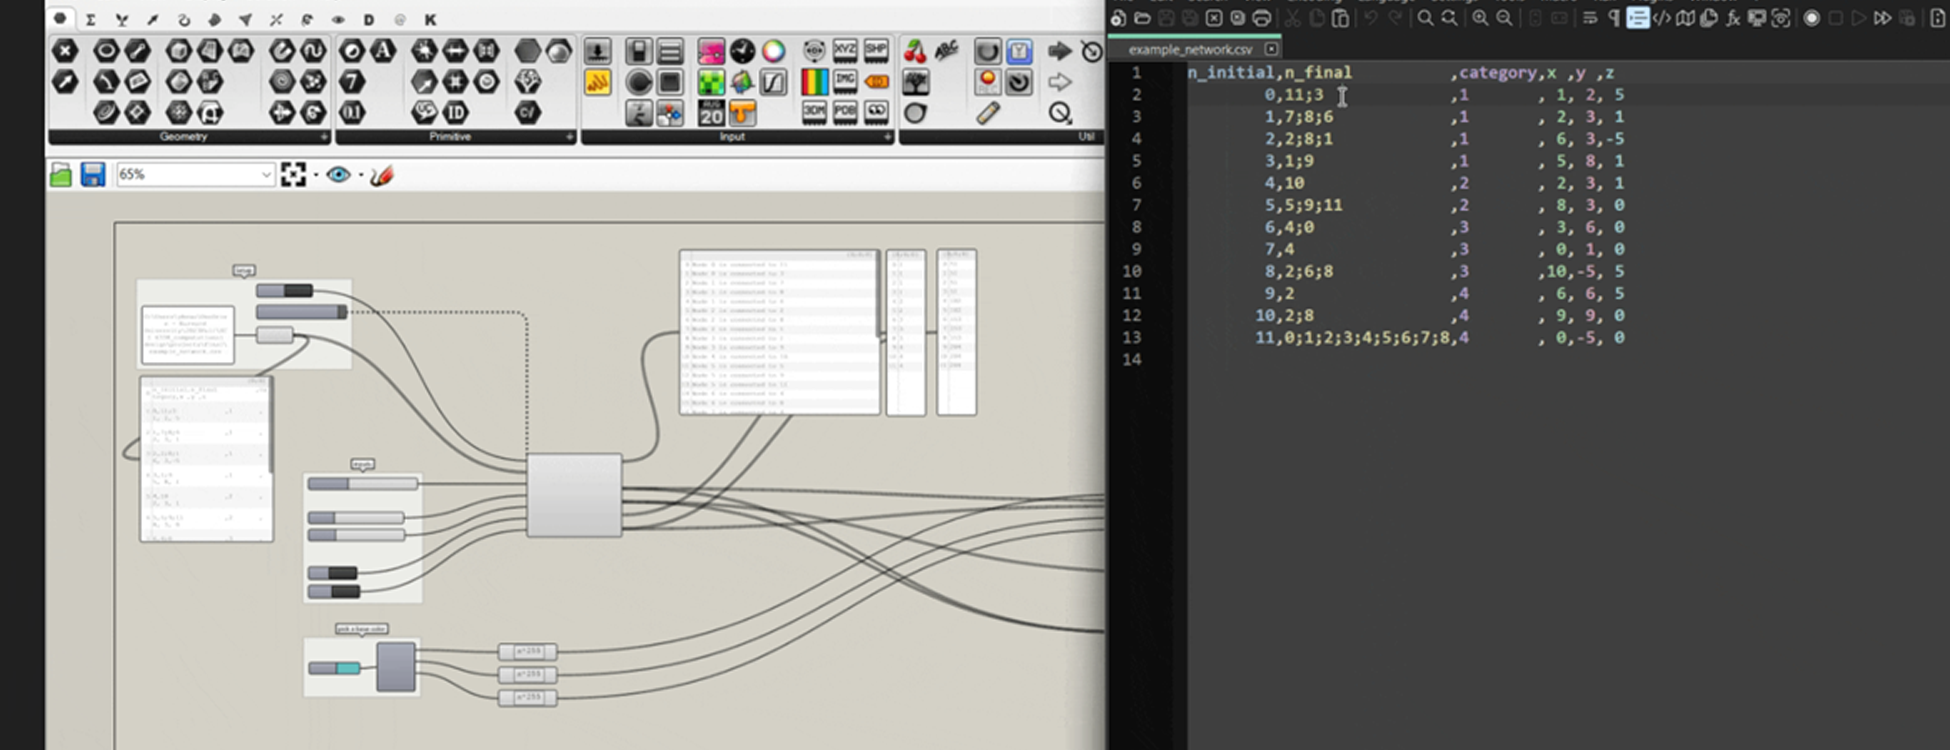
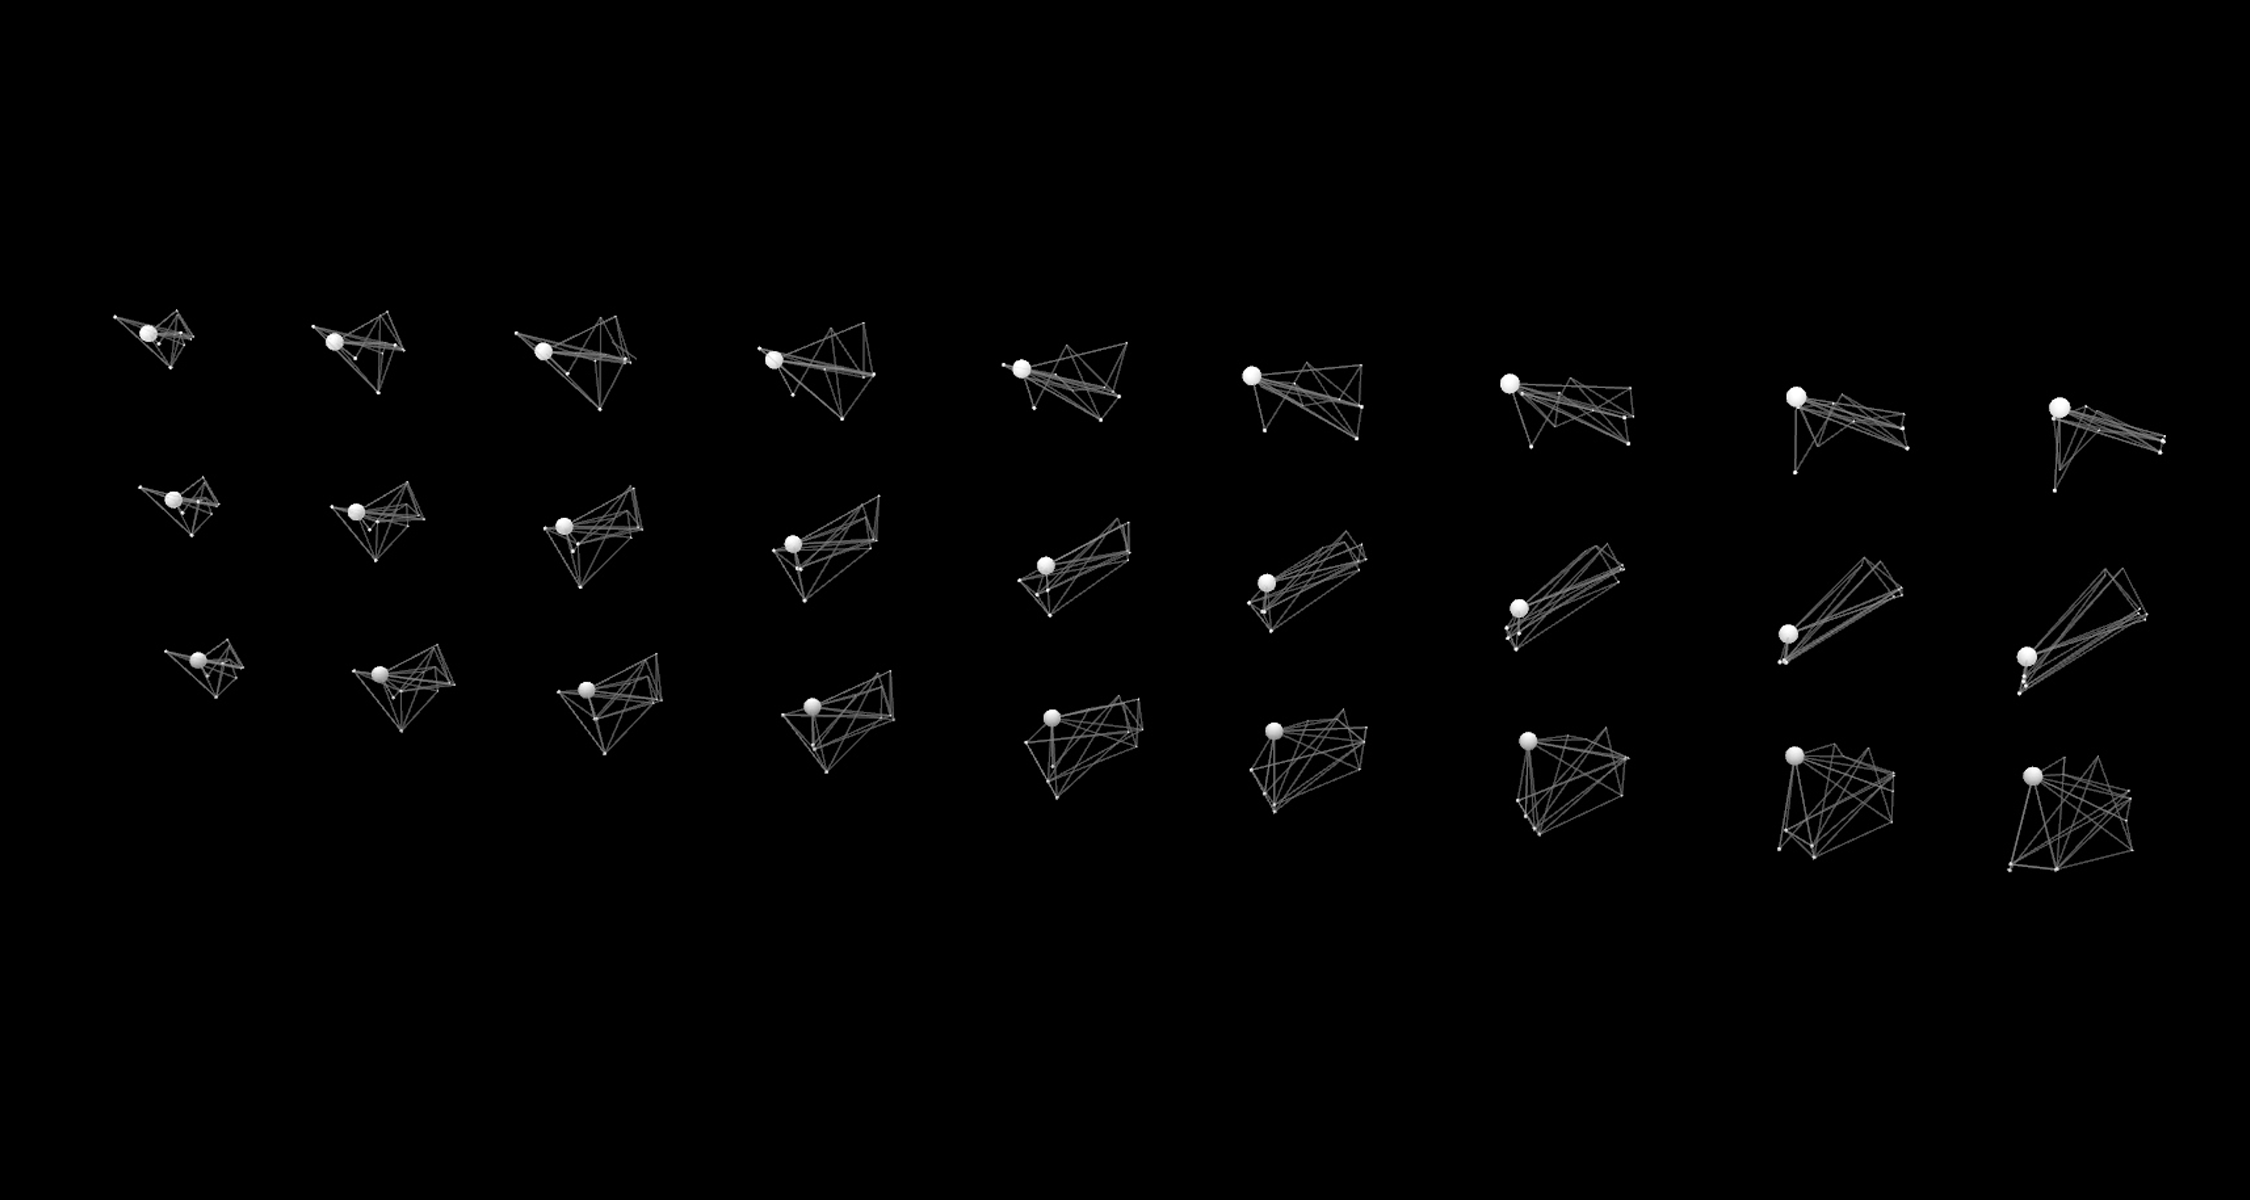
The project explores 3D animated representations of networks using Rhino Grasshopper and C#. A simple and editable graph data structure was used, a csv file containing nodes, connected nodes, categories, and a starting XYZ position. Using attraction and repulsion forces, the user can animate the graph representation, parametrically changing whether nodes are attracted to nodes of the same category, or of the same degree. The size of the node is proportional to its degree, and the color corresponds to its category. The space in which the nodes move can be changed by a bound parameter, and a friction parameter can change the speed of motion.