Study of Sedimentation
Mapping Temporal Changes in River Dynamics

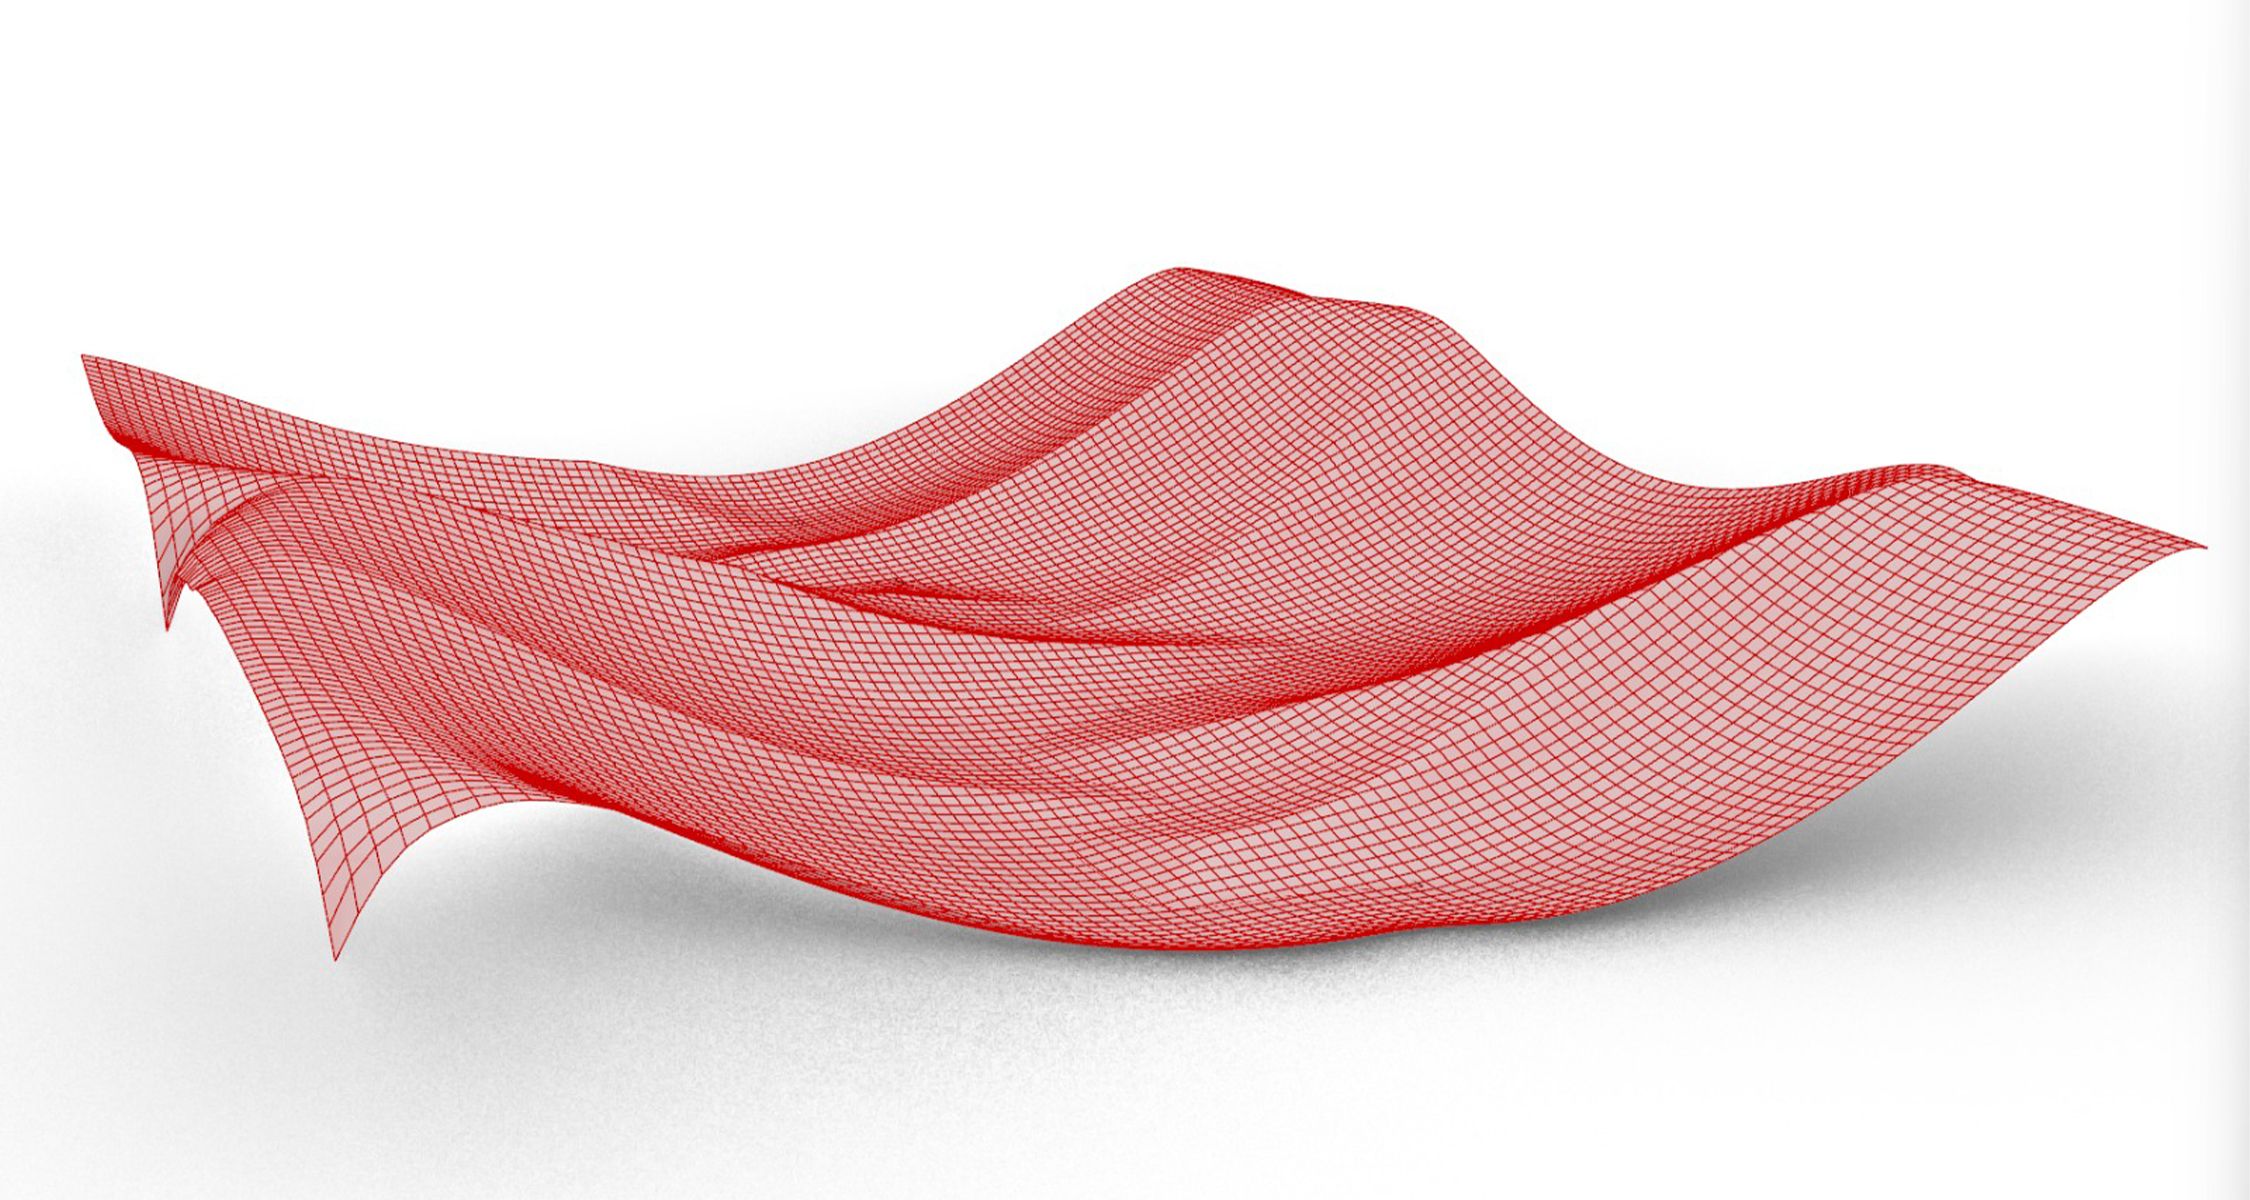
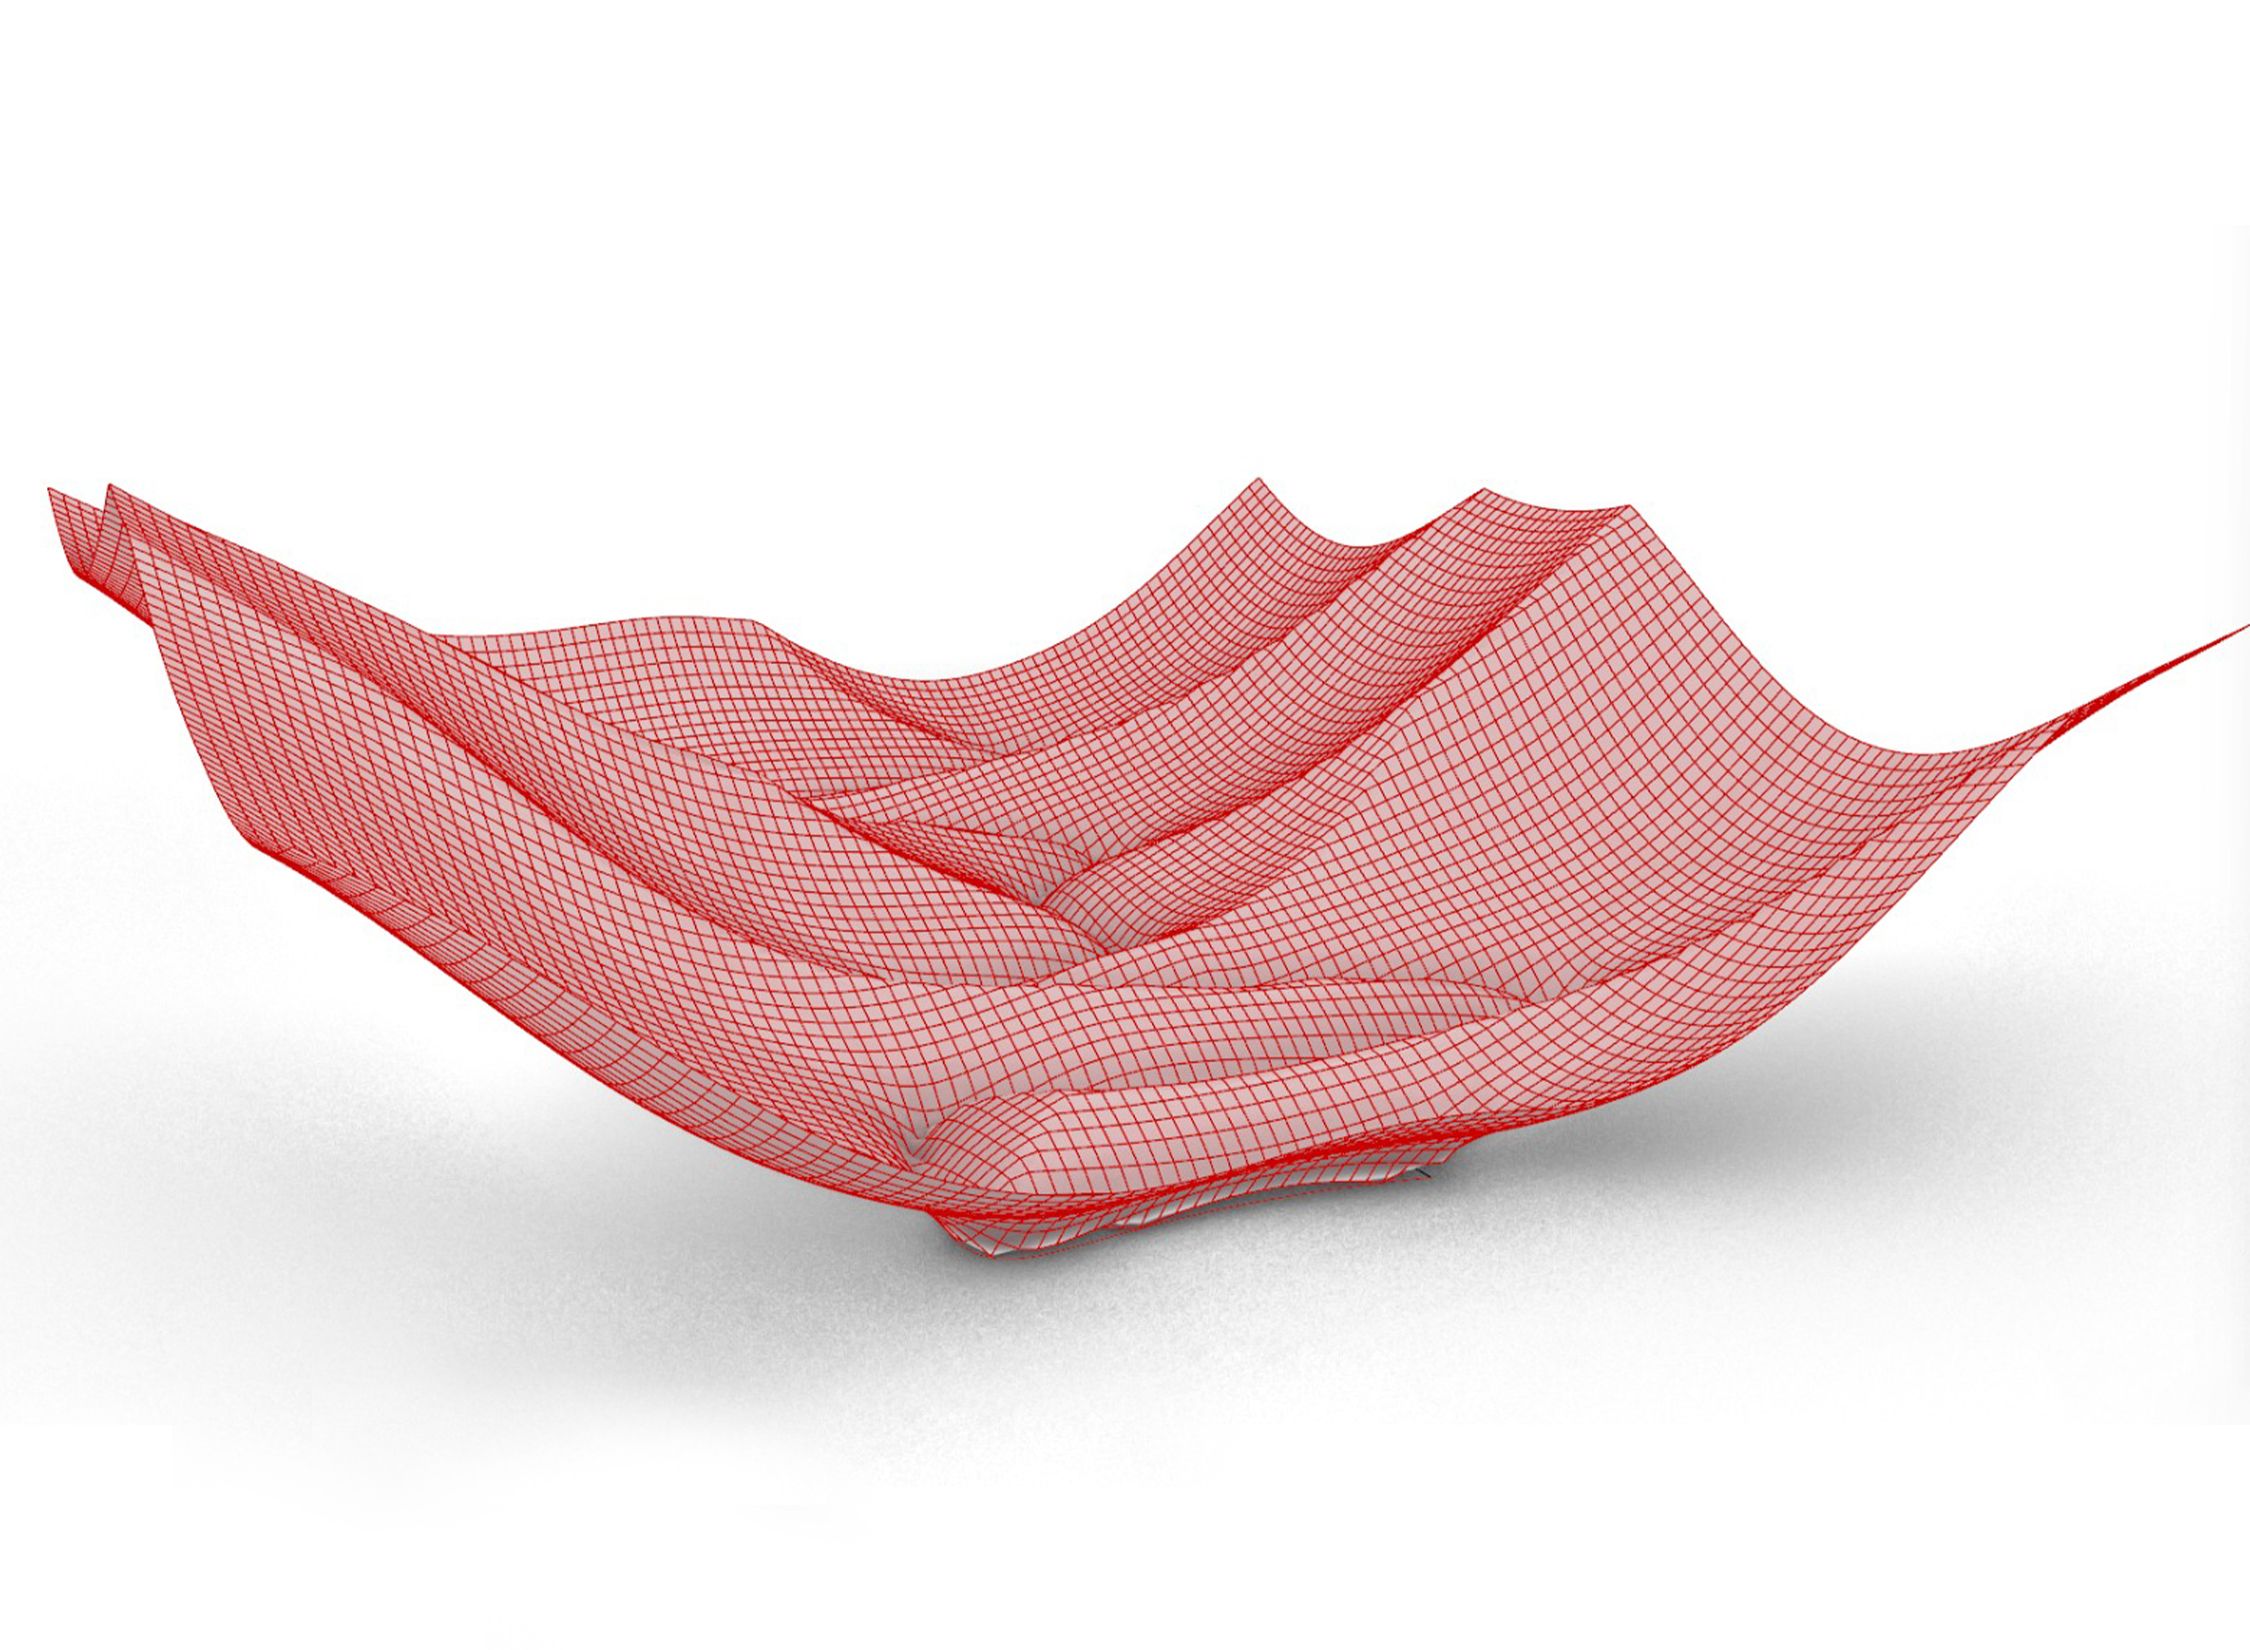
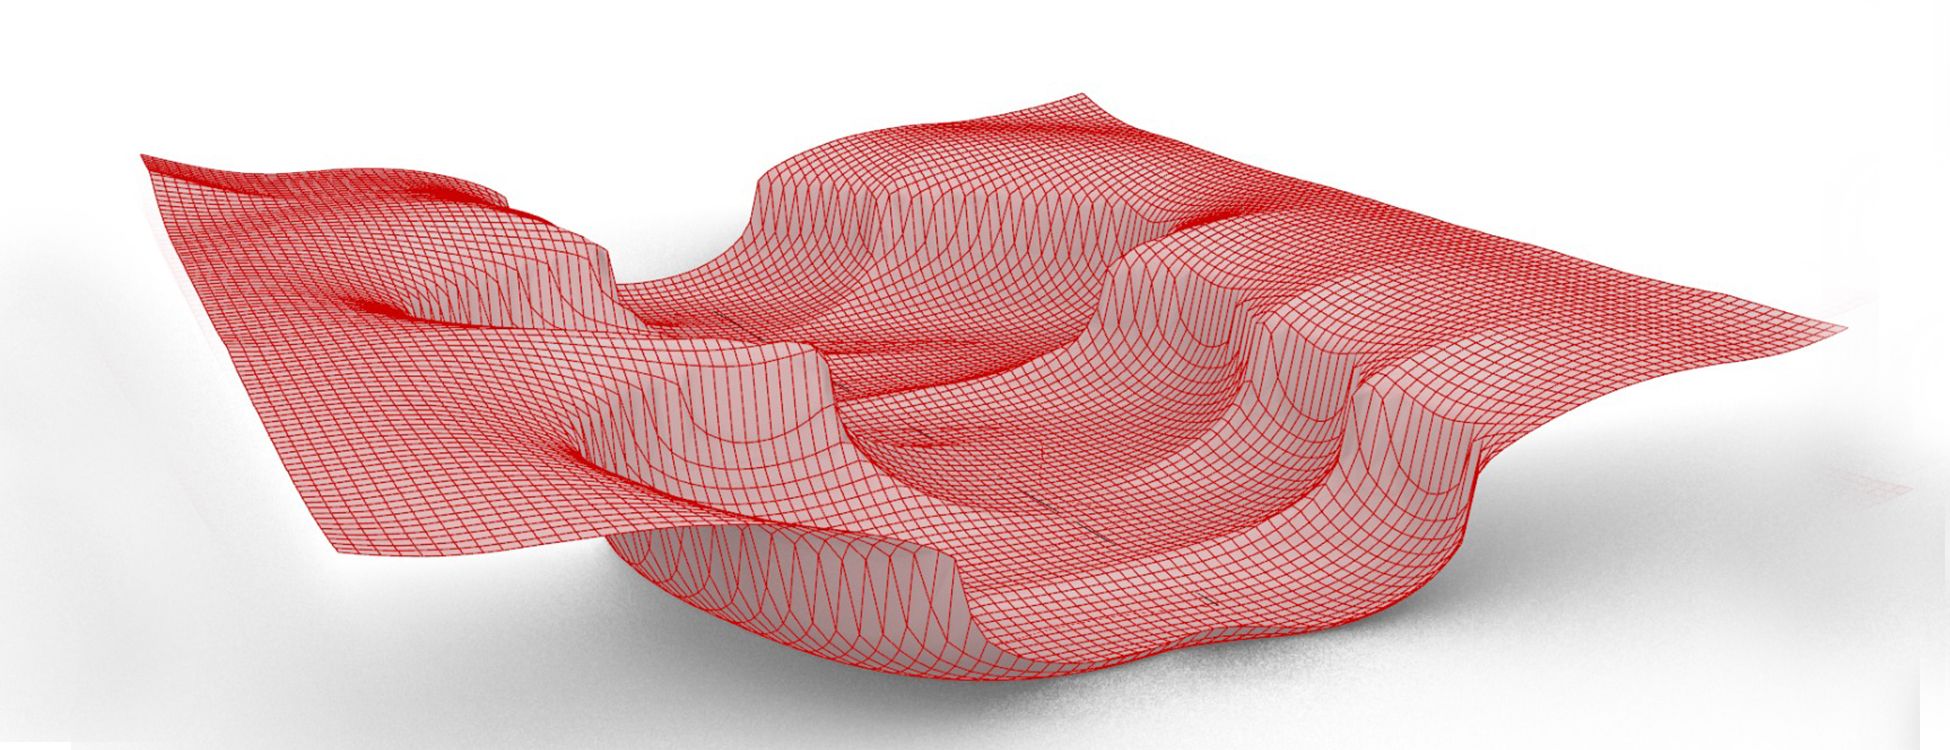
In this project, we explore the relationship between time, the flow of water, and sedimentation. Our inspiration comes from Harold N. Fisk’s drawing of the Mississippi River’s path over time, which illustrates how the river has changed course due to sedimentation. Both the river and its bed serve as representations of the passage of time, as the riverbed undergoes erosion or sediment deposition influenced by climate, weather, and water flow. As the riverbed transforms, it simultaneously affects the course of the water.
For this assignment, we use Rhino geometry to mimic the flow of water and its changes over time. We begin by drawing a sine curve and selecting four random points to create interpolated curves. By altering a single variable in the sine equation, we generate multiple curves that appear seemingly randomized yet remain geometrically related. These curves are then mapped to a surface representing the riverbed. The z-axis of each control point on the surface is determined by the distance to the nearest point on the curve. This variation in curves creates different topographies on the surface, simulating how the river erodes land and alters its course over time.

