AIRSCAPE
Mapping the Invisible

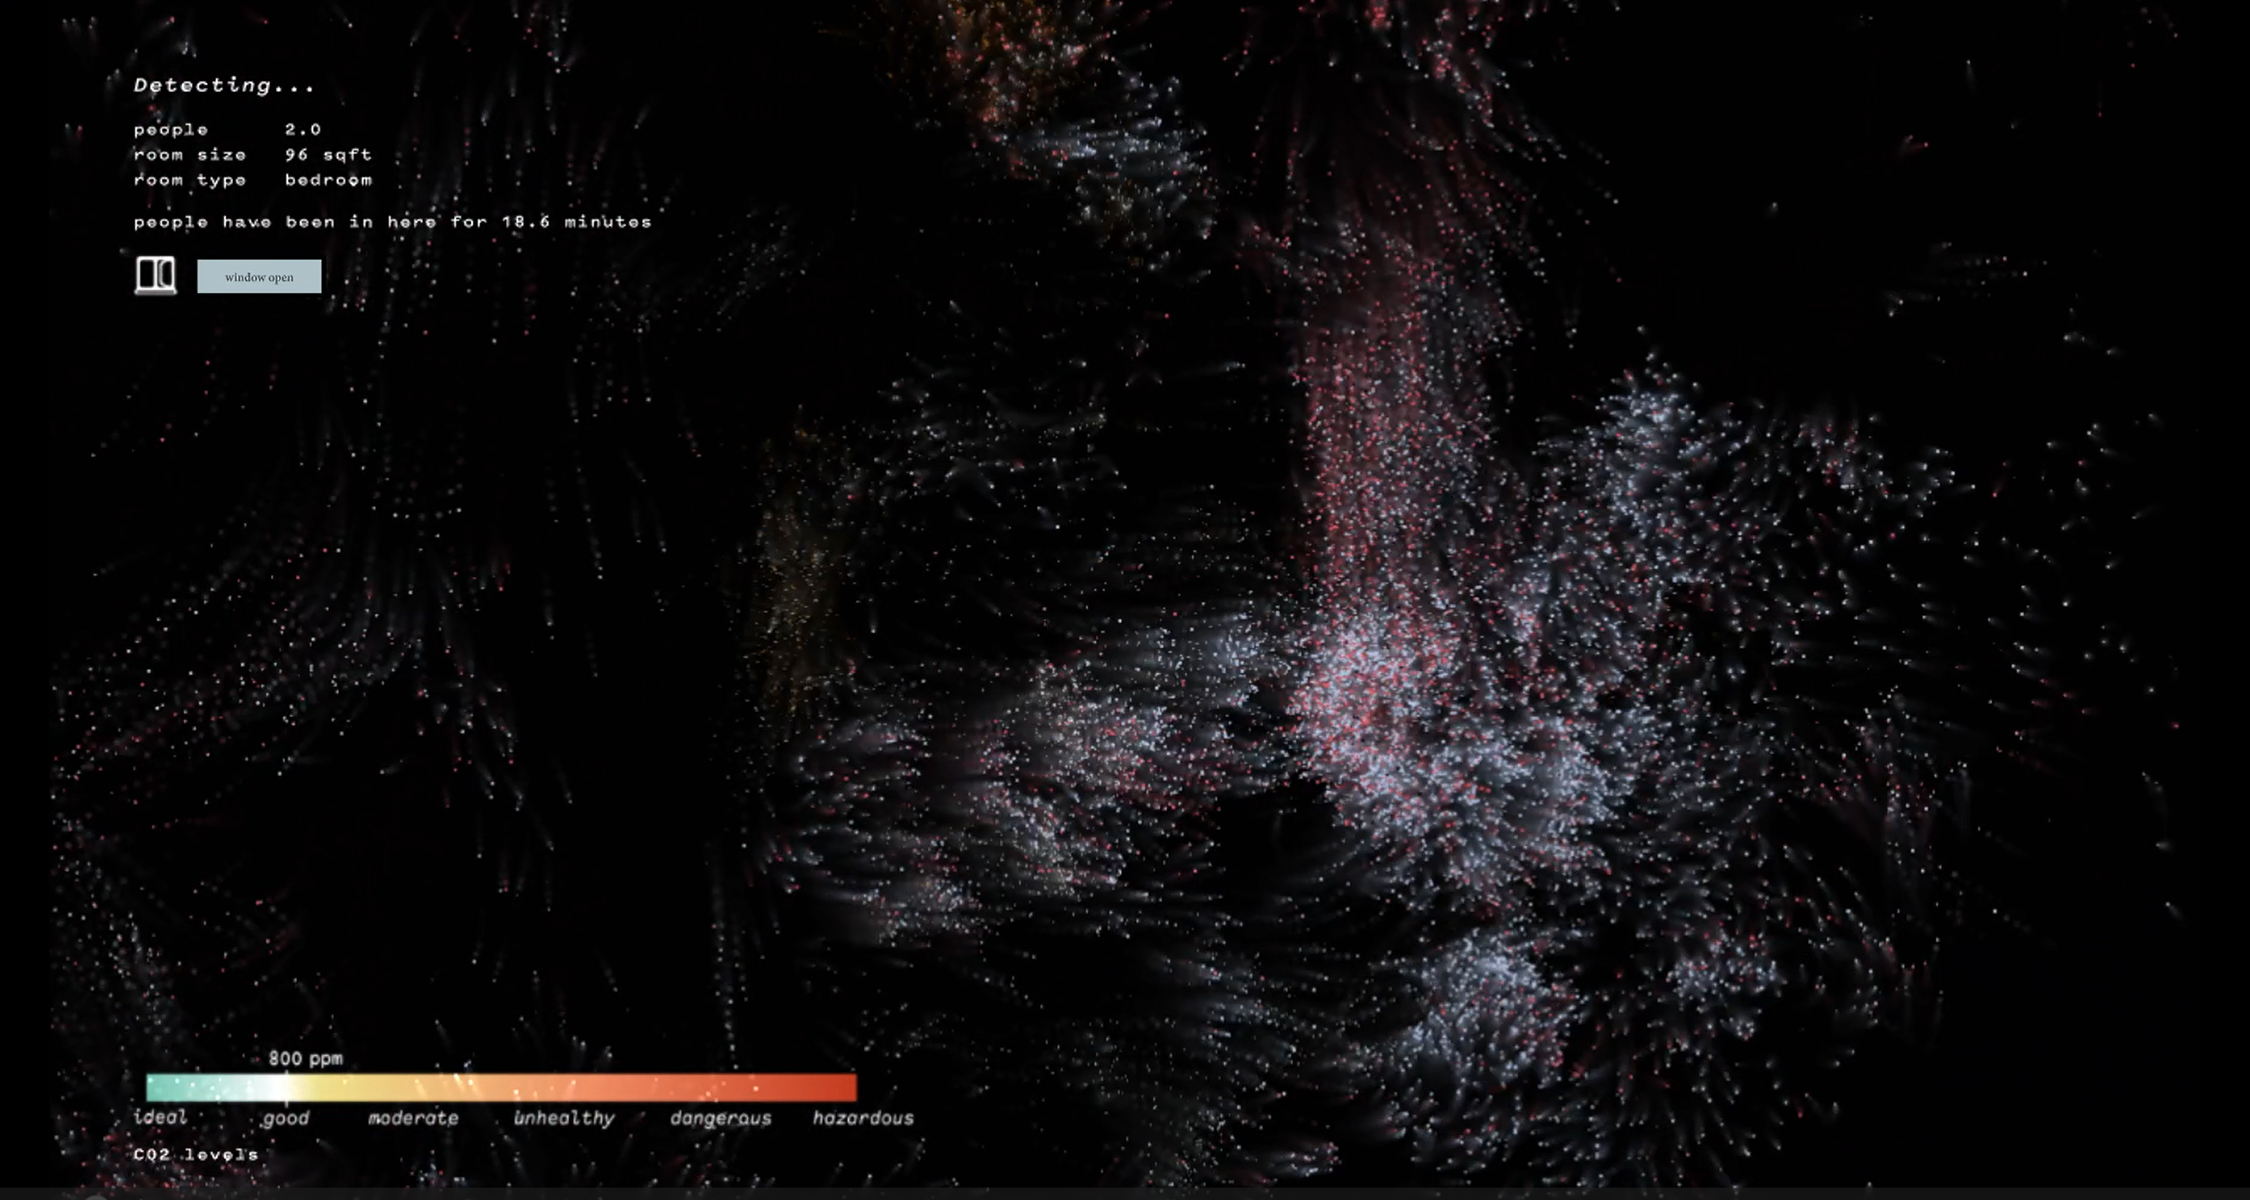
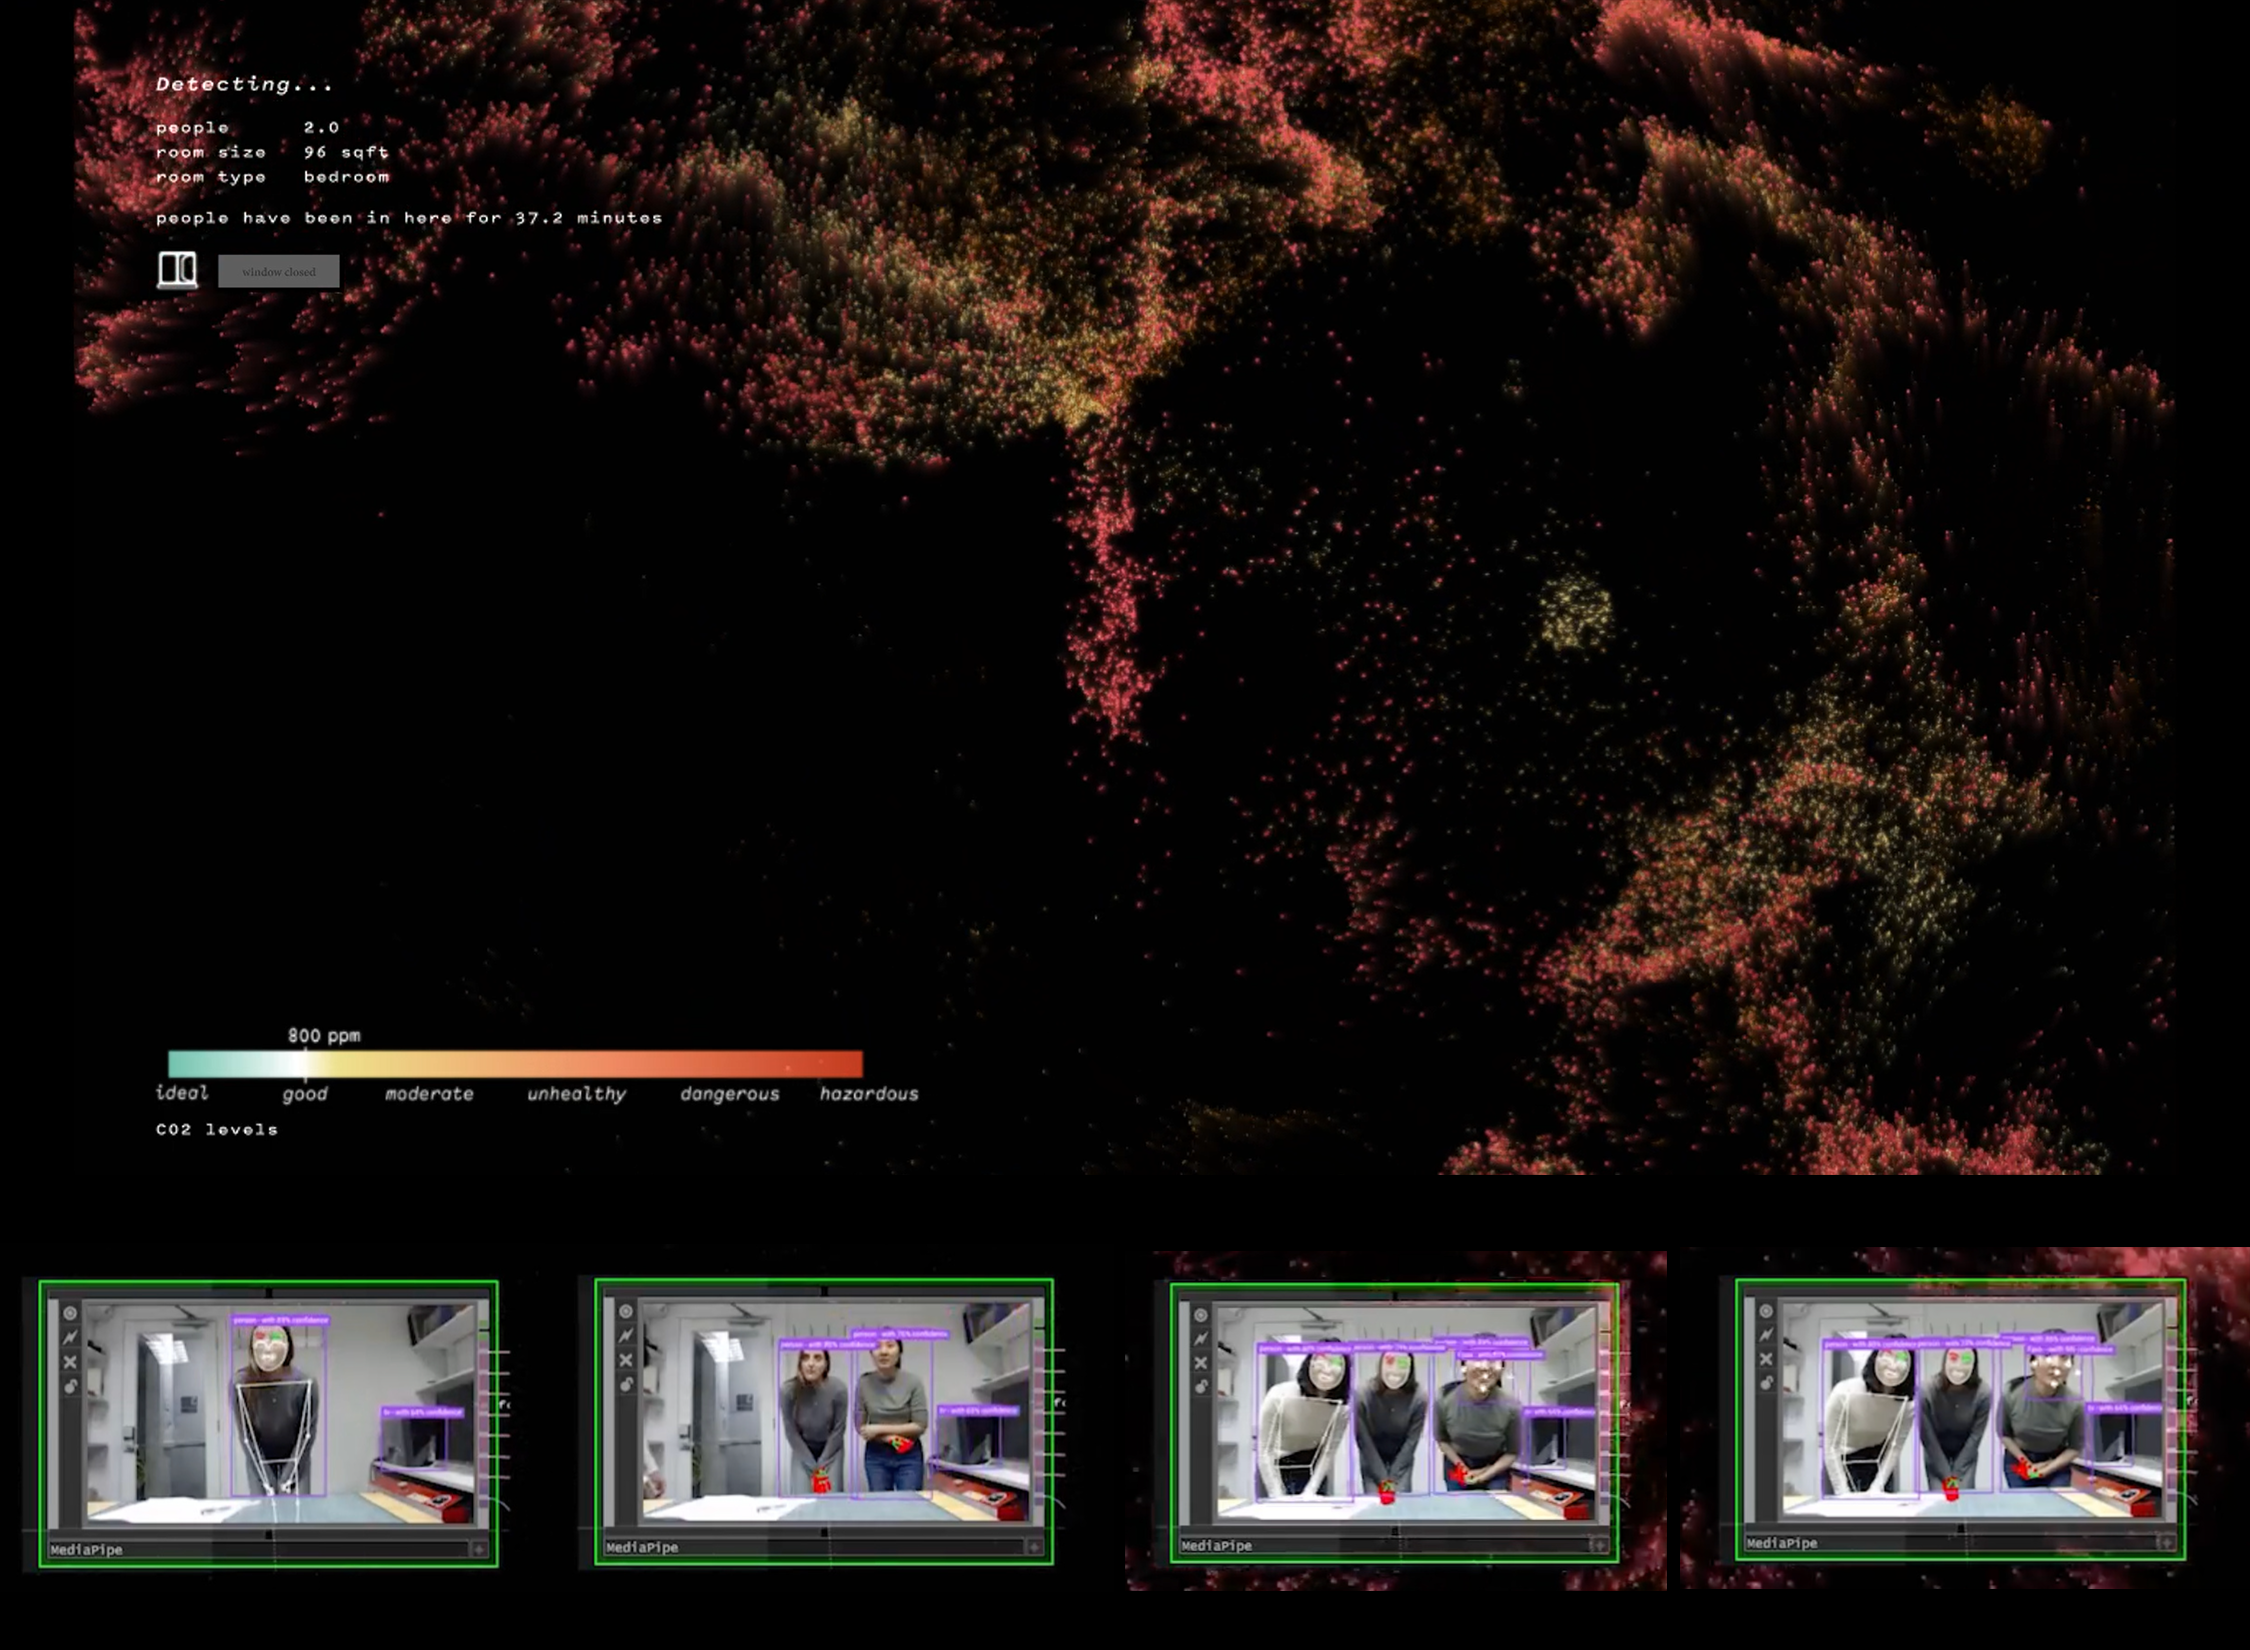
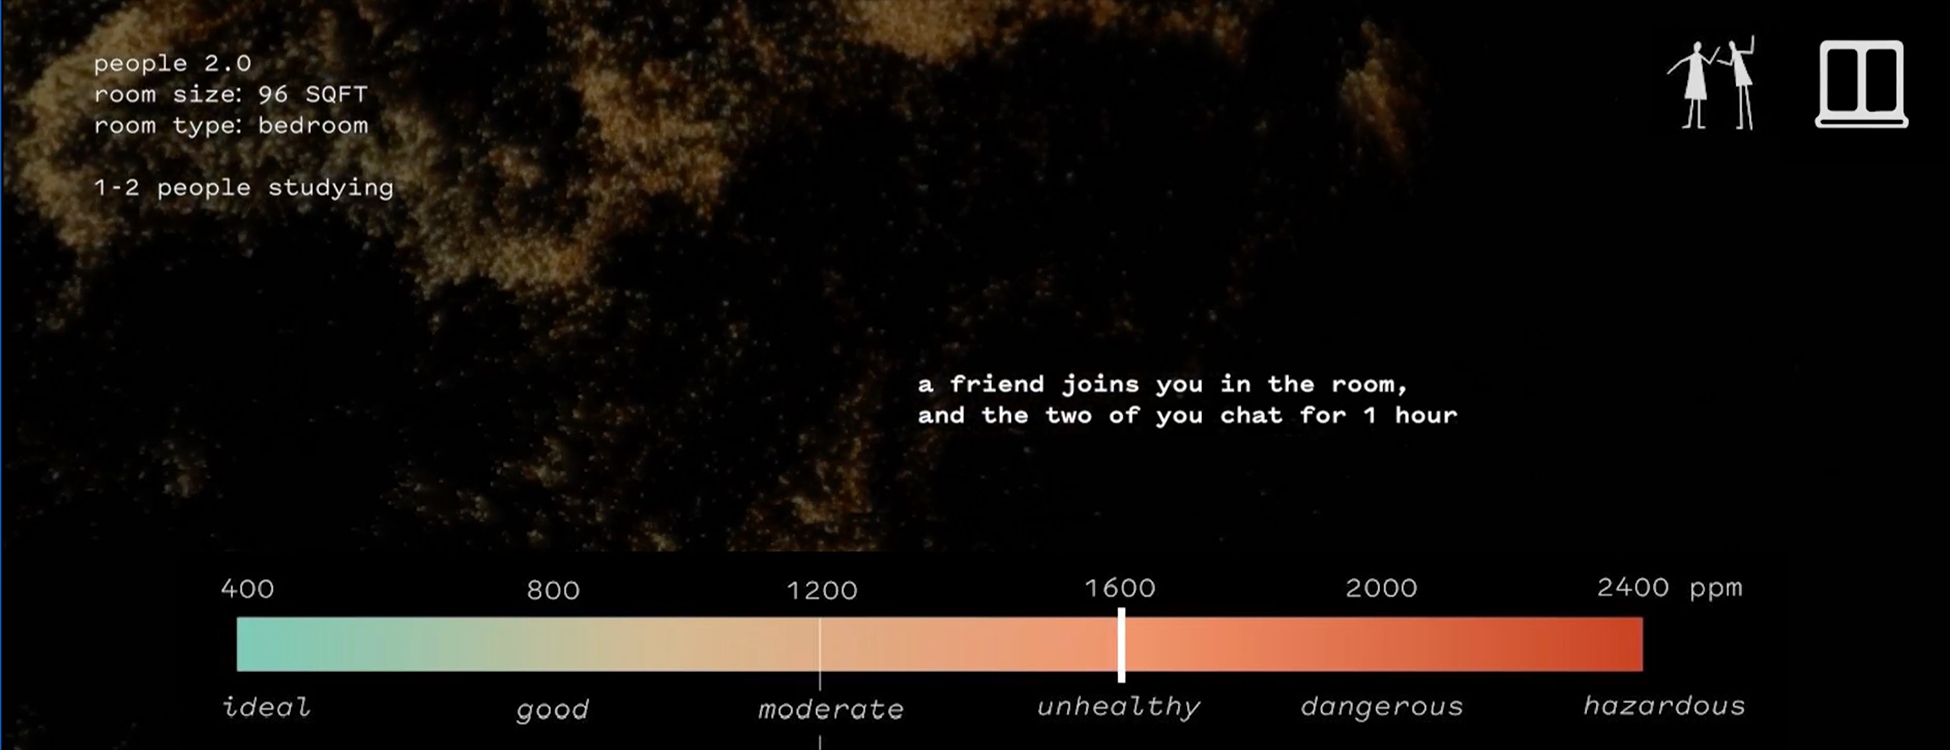
AIRSCAPE reveals the hidden dynamics of indoor air by capturing human motion and translating it into visualizations of CO2 particles. Using TouchDesigner, the project shows flowing patterns of particles that respond to and interact with camera input and body tracking in real-time. The visualization represents CO2 levels, with the particles emerging from human presence. Particles move, cluster, and shift, visualizing the relationship between occupancy and air quality. As more people gather, colors transition from calming blues to vibrant oranges and reds, reflecting the rising levels of CO2 generated by human activity and corresponding to health levels, as indicated by the bottom left color gradient legend. These visual changes make the imperceptible tangible, connecting our actions to their impact on indoor air.
Opening a window makes the particles fly more rapidly, and the colors reset back to a soothing light blue of lower CO2 levels, indicating the purification of the air. This transformation demonstrates the importance of ventilation, showing how a simple action can improve indoor air quality. By bridging data and design, AirScape helps users better understand the role of CO2 and ventilation in maintaining healthier indoor environments, inviting reflection on how our everyday behaviors shape the spaces we live in.

